
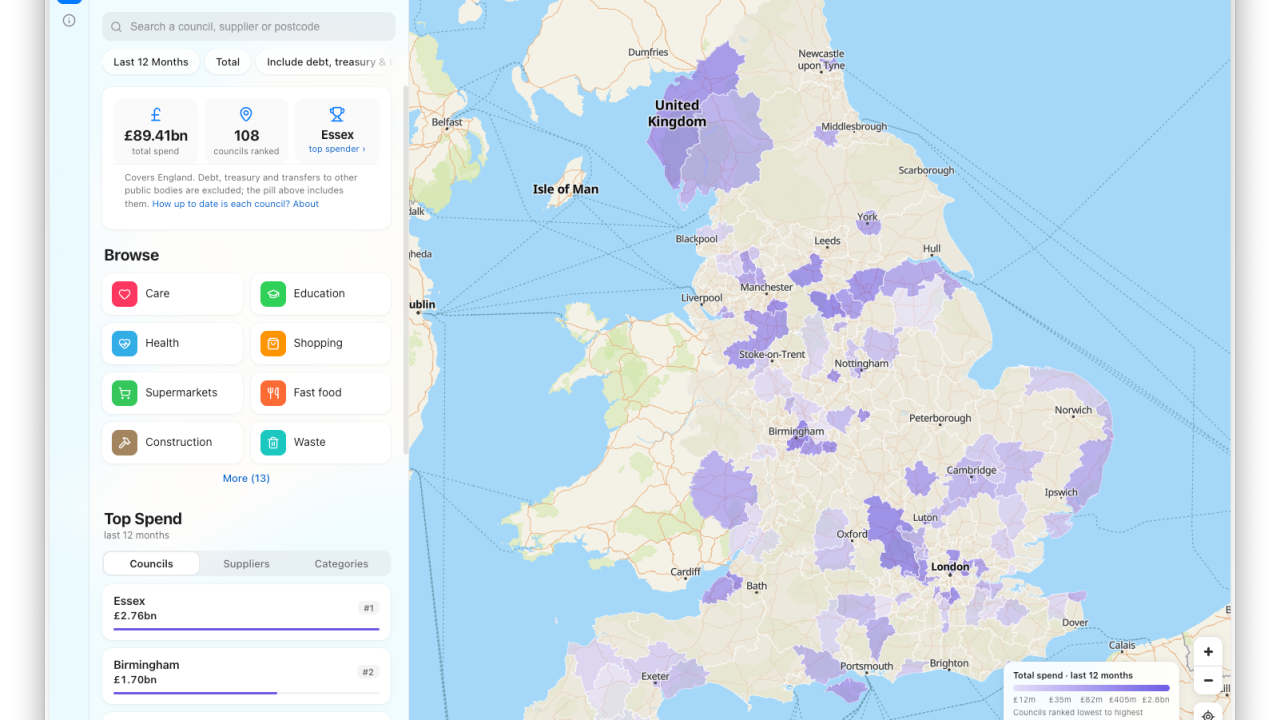
Hello again 🙂 sorry for the delay (agents + video exports!). This is one of the bigger things I’ve built.. I scraped 107 million rows of UK council spending data and built an ‘Apple Maps’ to see what each council spent, on what.. → check out the website.
All of the data is publicly available, but not easy to find or format.. Many of you aren’t from the UK, but the data (and the build) was a pretty interesting journey.. The session summary which includes all the linked files and prototypes is here.
There’s also a tab to view the entire full agent sessions from this build too.. I’m still doing final tweaks to the site and data before open-sourcing it.. This week’s format is a little different – my video explains it..
Stats:. 8.2 billion tokens. 235 messages from me.
656 subagents (ie an agent delegating work to another agent). Share Ben’s Bites. I was thinking about what public data is out there that people don’t know about, or that’s interesting but awkward to get hold of and understand?
I batted ideas back and forth with Codex and landed on England council’s payment data. Every English council has to publish what it pays out over £500.. Codex spun up three subagents (in separate threads) to find the information (as it’s spread across the council’s web site, often in weird formats) and pulled together a catalogue of 31 official sources.
Then it came back with real data from five councils, logging every download with a checksum fingerprint (this makes sure the data is what we actually pulled or did it change). Then I started asking questions about the data “who’s spent the most”, “what did they spend”, “who did they pay in various categories”..
Once we had some data, it got flattened (put into one format) into one big spreadsheet. I live in Bedfordshire so I asked it to pull that in too.. As data was being pulled together there were things I hadn’t thought about yet, like Bedfordshire being Bedford, Central Bedfordshire and Luton (so a subagent went off to get the other data).
Two of them blocked the agents at first but they figured their way around it. By the end of it I had 8 councils, 1.8 million rows, and £9 billion of spend sitting in one big clean CSV on my laptop. I also had a mini blueprint of my data collection plan..
Now I wanted to see it. I asked several agents to build prototypes to visualise the data in different ways. A receipt.
Then a bank statement. Then a grid of counties. Then a mini-site called ‘Your county’s favourite retailer’.
It published everything straight to [here.now](https://here.now) (a super simple web hosting for agents) so I could click through the real thing instead of screenshots. I also had it generate a few Pudding-style data visualisation stories too.. Some of the protoypes:. data story like The Pudding does.
I kind of left the design stuff to the side as I thought about all the data I’d need to make this as complete as possible. I use a Macbook Air so I don’t want a ton of spreadsheets sitting there, but fortunately I have a Mac Mini where we could put them all. I said “whats the best way to work with a lot of data”, I assumed it would be so big it would take forever to search it and categorise things.
Codex’s answer was Parquet and DuckDB (both of which I’ve never heard of before). Parquet stores the data in columns so a question only reads the bits it needs. DuckDB is a database that lives in a single file and is quick with big tables..
Codex set up the Mac Mini, Parquet and DuckDB and tested it. Then we started planning the full data collection: there are about 382 councils across the UK, and we were tracking the 339 in England and Wales. I’d collected 78 councils, 34.35 million rows, but six councils, including big ones like Lancashire and Norfolk, were blocking our scrapers (for now).
And I later found out Wales doesn’t have the same mandate as England in terms of spend reporting so eventually I dropped Wales councils.. Setup done, so I set Codex running on one /goal (keep repeating the tasks until everything is done): find every council’s spending page in England, download everything available, flatten and format it all, have an auditor subagent verify the numbers, and load it into DuckDB on the Mini..
It ran for nearly 2 days straight. I kept pushing it to go faster (it often keeps space on the computer but was reserving way too much), use more subagents, etc. 552 threads later, we had 319 out of 339 councils collected or in a parked state (no data or no way to get the data)..
Data acquired, time to prototype again. I had four different tools building at once (all with the same prompt, just for options): interactive comparison cards, a Council Ledger, charts, maps. One of the options was the Money Map: a map view of the data.
This one felt much better for seeing everything at once.. I got a bunch of supplier logos to show on the map and played around with it to separate councils and see what looked and felt best.. Map direction was settled.
So I first said to build a Google Maps clone, which was fine and I could’ve just pursued this direction but also got other agents to spin up Apple Maps versions which felt much better. I fed it some screenshots to get it even better. And with every visual direction I published them with [here.now](https://here.now) so I could test on desktop and mobile easily..
This felt great. Clickable council outlines coloured by spend, category filter pills across the top, a ranked list on the left, and a working search for councils and suppliers. It used mock figures at first to get the visual hierarchy right (I’m more often asking for mock prototypes before building these days to explore design directions).. google maps direction. apple maps version.
Only now did I realise we had a lot of files all in different places, so time to clean it up. The app, the data and the design experiments were scattered across three different folders, so we consolidated everything into two, one for data and one for the app. I also started cleaning the data: four subagents classified 2,000 unknown vendors, we set up date ranges, merged duplicate suppliers (Tesco showed up under six different names), and ran proper reviews of the naming and the categorisation. pi spent an hour rewriting categories..
And testing! Some of the data felt off and I found out there was a £5m threshold filter being applied for some reason. The reason is this app doesn’t have a backend, it’s a static site so instead of loading all the data it just capped it so that less was needed.
I just didn’t want to have a proper backend if we didn’t need one, dump all the data into files, load them at publish and filters just filter the data instead of communicating to a backend. We’ll see if this was a good or bad decision when/if people use it!. one of many review documents.
The last 10% takes the longest. Kinda. The last few days I’ve been less focused on just this one build but a lot of what was being done was reviews (code, data, design), implement changes, test again and then repeat.
Checking if categories felt representative or if there’s a large enough chunk of data that warrant it’s own category (like Pension Funds).. I mostly get the agents to review, often I dump a voice notes and/or screenshots, it comes back with a list and I say ‘yes’ ‘no’ or ask questions.
This is the part of the build I don’t love because I’ve spent enough time that I just want it shipped. It’s hard to process so much text from a review that I don’t always read it all either. But there’s some things that just have to absolutely be right – the validity of the data being a big one here.
And I’m pretty fussy with user experience so I did my best to get that covered as much as possible. There will be some bugs but I think it turned out pretty well.. Share Ben’s Bites.
Find me on X. Read about me and Ben’s Bites